Yesterday in class we recieved 2 sheets. One of them was called Carrying capacity. Carrying capacity is how many organisms can survive in an ecosystem. The other sheet was called Predator-Prey Interactions. On that sheet it told us that one species of animal can effect another population of animals.
Today in class we went over the questions on the Predator-prey interactions. We discussed ways in which the deer/wolf population could increase/decrease. For example, when the deer population would go up so would the wolf population a year later because there would be enough food for it. If the deer population went down so would the wolf population since there wouldn't be as much food. (see picture below)
Later in class, Mr. Banow gave us a sheet similar to the Predator-Prey Interactions sheet for marks. On this sheet we had to make a graph and answer the questions on it. We also found out we will be having a quiz tomorrow on limiting factors, ranom sampling, mark recapture method, and carrying capacity.
Next will be Shelby
Tuesday, 20 December 2011
Monday, 19 December 2011
Carrying Capacity/ Predator and Prey Interactions
In the beginning of class Mr. Banow did a homework check on our "Limiting Factors" worksheet. The Worksheet consisted of determining if a statement was density dependent or density independent. We also reviewed what density dependant and density independent meant.
Later on in class, we were given a worksheet called "Carrying Capacity". Carrying Capacity means the maximum amount of a particular organism that can be supported in an environment. The worksheet is about how a forest fire has effected the growth of Jack Pines and the growth patterns of the Jack Pine since the forest fire. We did questions 1-7 on the worksheet in groups.
We were also given another worksheet to work on in groups. The worksheet is called "Predator-Prey Interactions. The worksheet is about how one species of animal can affect the population of another species of animal. On the worksheet there was a graph to make on how the populations of deer and wolves fluctuated from a ten year span. We also did questions 1-9 on the worksheet.
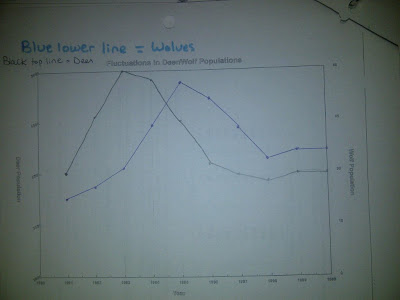
Picture of the Graph on Predator and Prey Interactions.
Population Dynamics Quiz
On Wednesday, December 21, we will write a quiz on Population Dynamics.
Key Questions:
1. What natural factors keep populations of organisms from growing forever?
2. What natural biotic and abiotic factors influence populations within an ecosystem?
3. How do scientists document population dynamics?
Those are the Key Questions for this section of the unit.
The quiz will contain:
- a list of limiting factors - you will identify whether they are Density-Dependent or Independent
- random sampling - understand how to complete the process
- mark-recapture method - know the formula and how to apply it
- carrying capacity - explain what is meant by carrying capacity and provide an example
Good luck!
Sunday, 18 December 2011
Density-Dependant and Density-Independant Factors
Class began by reading an article in our groups titled, "Starving Orangutans May help better Understand Obesity and Eating Disorders in Humans".
Afterwards, we reviewed the terms density-dependant, density-independent, and limiting factors. There are two categories under limiting factor: density-dependant and density-independent. The difference between them relies on whether or not the size of a population influences the factors preventing species numbers from constantly inclining. A density-dependant factor is effected by the size of the population. For example, habitat availability would be a density-dependant factor, since the amount of proper habitat areas that are obtainable would change with a higher or lower population. However, a density-independant factor is an element that is not swayed by the numbers of a species. For example, a drought would be a density-independent factor because, though many species are effected by it, this event would occur regardless to how large the population was.
After reviewing this, we recieved a sheet focusing on determining density-dependant and density-independent factors. On the sheet we were given various situations in which we had to label either density-dependent or density-independent. We worked in groups of three on this assignment for the rest of class.
Tuesday, 13 December 2011
population
We first looked at an group article about silverfish living in army ants colonys. The silverfish cover themselves in at army ant's scent . Then we defined some words. After we looked at some population graphs and and environmental factors and population size sheet. And were supposed to answer the question (my bad I forgot to).
Friday, 9 December 2011
Biodiversity Quiz
On Wednesday, Dec. 14, we will write a short biodiversity quiz.
The quiz is based on our Key Questions for this outcome. You should be able to answer all of the questions by using clear examples.
The quiz will be all written answers. It will contain 5 questions.
Key Questions
1. What is biodiversity and how is it measured?
2. How does biodiversity serve as an indicator of an ecosystem's health?
3. How does energy flow through an ecosystem?
4. How does an interruption in energy flow affect components of an ecosystem?
5. How does matter such as a toxin become more concentrated in an ecosystem?
6. How and why are plant and animal species introduced to new areas?
7. How do Canadian scientists classify at-risk species?
8. What are some examples of at-risk species in Saskatchewan? Canada?
9. How does protecting at-risk species help to improve an ecosystem's health?
Thursday, 8 December 2011
Zebra Mussels
Today in class we started off by going into our article groups and read an article.
We then went over the the story we read last class about Zebra Mussels and talked about it for a while. We then did two questions that related to the story and we had to make a chart about the negative and positive things in Zebra Mussels being in the Great Lakes. Then at the end of Class we watched a video.
Next is Lucas
In class today we did a article that talked about how fish will evolve to different temperatures. The we talked about the blog about last class on extinction and endangered species. In today's class we talked about what happens when a new species is brought into an ecosystem. After that we talked about how a lion would change a whole ecosystem at a farm with lots of other smaller animals. We learnt 2 new vocabulary words fist one was introduced species it is an organism that is not native to the place or where it is considered introduced. It has been accidentally or deliberately transported to the new location by human activity and also we learnt invasive species it means an alien species whose introduction does or is likely to cause economic or environmental harm or harm to human health. Towards the end of the class we talked and read about the Zebra Muscles they attatch to every object the started in Ontario and went down to the golf of mexico plugging pipes and hydro plants.
Tuesday, 6 December 2011
Endangered Species
Yesterday we read about endangered animals, bald eagles being one, and how the number of them was declining because the toxins in the air were effecting the shell which was making them weak there for the eggs were breaking and the birds were dieing. We were then assigned some questions.
Today in class we started by reviewing the questions we did last day, and discussed them as a class. We then went on to a reading (page 16-19 in textbook did questions 1,3) on endangered and extinct species. We learned about passenger pigeons and how the number of them drastically decreased due to commercial hunting/removing forests and "stool pigeon". The reading also talked about how humans are mostly to blame for the large number of endangered species (rate of extinctions=80 species per/year) some examples include: Global warming, and expanding cities which are reducing the sizes of the ecosystems.
We finished the class by watching a short video on the Burrowing Owl.
Next is Ryder
Monday, 5 December 2011
Endangered Animals
Yesterday in class we watched a video about how herbicides can be harmful to frogs and that there are other things we can do like use boiling water, vinegar or pull the weeds out. Scientists suggest we should not use herbicides but in the end society decides whether or not we use it.
We learnt about endangered animals and disscussed what people could do to help to do to prevent it like making safe places for them to live. Then we watched another short video about how many of the endangered species are found in the oceans and that they once killed 3/4 of whales without realizing it.
We then read about bald eagles, there were a lot in the 1700's and 1800's but there was decline in the 1900's. The causes of this might have been because the eggs of the eagles would become thin and would brake easier due to the toxins.
Next is Ashley
Friday, 2 December 2011
Food Webs
Today in class we received a booklet about food webs. Food webs are just like different food chains put together with a variety of plants and animals.
In the same booklet we learnt about food pyramids. There are different types of food pyramids. They can tell you the mass of the animal or how many animals you need to produce enough energy for the larger animal that eats it. On the bottom of the food pyramid is a producer. ex: grass. Above that are the primary consumers. They are usually herbivores. ex:mouse. Above that are the secondary consumers which can be carnivores or omnivores. ex: snake. On top of the pyramid are the tertiary consumers which are usually carnivores. ex: owls.
After that we did the questions at the end of the booklet.
Next time write will be Shayla.
(written by Jamie)
(written by Jamie)
Thursday, 1 December 2011
Wednesday, 30 November 2011
Frogs and ecosystems
Today in class we started off by listening to the article presentation. Then we discussed the frog questions from last day. We also talked about how frogs effect our ecosystem, and how they are a major part in more then one food chain and that the frog is a good indicator if an ecosystem is healthy or not.
Tuesday, 29 November 2011
Frog assignment
In class today we started out reviewing what we did the day before, we then did are presentations from students that we do every day and also read the blog from previous day.
After that we started on an assignment reading about frogs and answering questions from the science 10 textbook. the assingment was on page 10-13 and it expalnded a lot of how frogs are part of our ecosystem and how they are in danger. most of the class finished before class ended.
next is Amy
After that we started on an assignment reading about frogs and answering questions from the science 10 textbook. the assingment was on page 10-13 and it expalnded a lot of how frogs are part of our ecosystem and how they are in danger. most of the class finished before class ended.
next is Amy
Carbon Footprint and Wolves
Today in science we discussed the carbon footprint sheet. We then spent most of the class doing a paragraph on if we think people should be in power of the earth and its environment or if we are just as important as other animals.
After, we discussed the wolf assignment. We figured out that by removing wolves, the coyote population increases while small animal population decreases, elk and deer population increase while plants have been decreases and making more diseases being spread and there is less carcasses which bring less scavengers.
Wednesday, 16 November 2011
Summary and Review
Today in class we started off by going through all the older blog posts and going through what each one was about and what we learnt for that day.Then the rest of the class we worked on our review sheets. There is a test tomorrow, and you need the review signed.
Monday, 14 November 2011
Lab Day and Review
We began class by discussing velocity time graphs and distance time graphs from last week. We discussed what each graph can tell us, such as velocity time graphs showing acceleration from calculating the slope (a=Vf-Vi over the change in time), and that distance time graphs can show the distance the object has travelled, by simply looking up at the graph and reading the data provided. We also received back our tests that we wrote on Wednesday.
We then moved into a lab called Cart Rolling Down an Incline: Is it Constant Acceleration? This involved a table to be lifted slightly using bricks, and a wooden cart. We attached some ticker timer tape to the cart and used the ticker timer to help calculate the acceleration of the cart as it travelled down the table. Using the data from the ticker timers, we put the lab results into a series of tables, which included total distance travelled, displacement, and average speed. The next step is to transfer this data from these tables into a graph.
Next is Zack
Friday, 4 November 2011
Last class we worked on find the slope of a graph by using the formula rise/run. We applied to some data given to us in booklets.
We learnt about Velocity time graphs today. We perviously learnt about speed time graphs. Time goes along the x axis and velocity goes along the y axis. With velocity time graphs we can determine the displacement of the data, the acceleration, and the average velocity.
the average velocity.Next is Brodie.
Thursday, 3 November 2011
Today we went over the question that you wrote on the board on Monday to start things off. When we were finished, we went over the last question on the sheet 'Slope of an objects Motion'. On this sheet there were graphs that we had to determine the slope of, by using the formula rise/run. When we were done this, we then looked at a curved graph. Then on that same page we did four seperate questions. We then talked about a tangent and how it only touches a part of something on one point.


After that we talked about the difference between average velocity and instiantaneous velocity, and also how they are the same. You then told us to do two questions on the back of that sheet and we looked at thm together.
Tuesday, 1 November 2011
 Today in class we worked on a booklet called "Slope of an Objects's Motion", it showed us how to figure out the slope of a graph. (Slope= Y2-Y1/X2-X1 or Rise/Run)
For example:
Point A: Rise/Run= 20/4
Slope=5
We also learned that if the line on the graph is slanting upwards it is becoming postive, and if the line is moving downwards in a slanting motion it is becoming a negitive. But if the line is like Point B, it does not have a slope and it's neiter a positive or negitive.
Sunday, 30 October 2011
Finishing Running Experiment
After doing the science article as usual, we finished filling in the chart for the experiment we began on Wednesday. This experiment was of three people running at different times, and someone recording their time at 25 metres, 50 metres, 75 metres, and 100 metres.
We then went over the expectations for the blog posts, and got our new assignment for the November articles.
After discussing that, we then went back to the sheets with the runners time on it. We had to find the average speed at the distance intervals, and then the overall average speed. To find the average speed we used the formula V=d/t, we rounded to two significant digits and put the results in metres/second. To find the overall average speed we added up all the times for one runner, and then divided that total number by the amount of numbers we had to find the results. We did this for all three runners, and then went over the answers as a class and made sure everyone understood how to get those answers.
Next is Jade.
Wednesday, 26 October 2011
Running Experiment
Today in Science we did our article as per usual.
we then discussed a experiment as it was a half day in which we would have three runners and people timing at different intervals such as 25m 50m 75m and one person at the start or 0m and on at the end or 100m to time the entire experiment.
We then wrote down our results of the experiment on a sheet we recieved from Mr.Banow.
Next is Amanda
Speed, Velocity, and Acceleration
We started off the class today by doing a journal called "Humans like to work together in solving tasks, Chimps dont". Once we were done that, we talked about the concept of velocity. We also explained the difference between velocity and speed. After we were done with that, you handed out the veolcity and acceleration quiz. We all corrected someone else's sheet. This took up most of the class. When we were done correcting, we looked at a sheet called speed, veolicty, and acceleration. On this sheet there were graphs, we looked at example 1 and described all the parts to it. After that, you told us to do the next two examples by ourselves.
Thursday, 20 October 2011
Speed, Velocity and Acceleration
Today we started out by summarizing a science article about the possible trigger for volcanic super-eruptions. It turns out that when the volcano heats up, the rock above expands and makes cracks on the surface of the rock. As the volcano get hotter the deeper the rock cracks. When the cracks get deep enough to expose the magma chamber thats when the volcano erupts.
Next we finished our articles we got a new seating arrangement. We all went and stood at the back of the room and when he called your name and said the table number thats where you sat. To determine where some one sits Mr.Banow pulls a number out of a jar.
After we got our new seating arrangement we discussed what we worked on last week. Last week we were working on Acceleration of everyday objects. After we were done discussing what we learned we did a couple questions off the smart board for hand in.
We also got a new hand out today about Speed, velocity and acceleration. We discussed and went through the first page. The last thing we did was work on 4 questions on the 3rd page.
Thursday, 13 October 2011
Finishing Acceleration of Everyday Objects Activity
We began class by reading and summerizing our articles. The article focused on a newly made carbon that can withstand as much pressure, if not more, than a diamond
We then continued our Acceleration of Everyday Objects activity sheet that we started last class. The first activity we did today involved playing cards and the rate they fell at. We learnt that two playing cards will fall at the same rate because the air resistance on each card is the same. However, when we did the same activity with a playing card and a coin, the coin fell at a faster rate. This is because that while it still had air resistance acting on it, the coins weight or mass overcame the air resistance. The playing card "fluttered" because the air resistance was greater than its weight or mass.
The next activity we did was with a text book and peice of paper. When dropped at seperately, the paper fell at a slower rate than the text book. This is because the air resistance on teh book was overpowered by the books weight. The papers weight, however, did not overcome the air resistance acting on it, causing it to fall at a slower rate. When we tried the same procedure with the paper placed on top of rthe book our results changed. The paper and book fell at the same rate. This is because the book blocked the air resistance from the paper, so the area between the book and paper was similar to a vacuum. A vacuum has no air resistance in it, so objects will fall at the same rate. http://www.youtube.com/watch?v=KDp1tiUsZw8
We ended class by getting in our groups for our Motion Technology project. We planned what we will do tomorow (or today) to begin our projects.
Next is Melanie.
Wednesday, 12 October 2011
Acceleration of Everyday Objects Activity
Today in Science we began with the article as usual. We then had about five minutes to finish the activity and questions from the booklet we began yesterday. We then went over the questions as a class together.
The questions we answered were about the activity that involved pushing two coins off the side of a table at the same time using a ruler, and observing whether or not both of the objects landed at the same time. After three trials, we substituted one of the coins for a marble and did the same procedure. When going over the questions as a class, it was determined that the coins should have landed at the same time as well as the coin and marble. This was because the gravity pull was the same on each object as well as the air friction.
We then moved on to the next activity where we put two coins on a folded card, and flicked the card to send one coin fall straight down and the other coin to fly across the room. After three trials we changed one of the coins for a marble and did the same procedure as before. We answered questions about this activity, and then went over them as a class. We discussed that the coins and the coin and marble should have landed at the same time because the initial direction does not matter.
We then did one more activity before the end of class that involved us using a regular piece of paper and a crumpled piece of paper, and dropping both at the same time and height. We did three trials of this, answered questions, and discussed the questions as a class. Each group should have observed that the crumpled piece of paper fell faster because gravity took hold of it faster, and had less air resistance than the regular sheet of paper. Right before the end of class we gave examples of human technology that would apply to this effect, such as a parachute and a sailboat.
Next is Jessica.
Tuesday, 11 October 2011
Accelleration of Everyday Objects
Today we did the article as per usual.
We then finished up the questions on ticker timer tapes that we started on Thursday. This was when we got to use the ticker timers to produce different speeds and see how it appeared on the ticker timer.
After that, we moved into acceleration of everyday objects by talking about different questions and a little bit of history. We wrapped the class up by starting a series of projects from a booklet.
Next is Amanda
Wednesday, 5 October 2011
Ticker Tape Timers
Last class we started off by doing our science journals, we then did a 2 question quiz on calculating speed to see if everyone understands it. Note that it is extremely important to be able to calculate motion in the science curriculum.
After we read an introduction on Ticker Tape Timers, it showed us how they are used and what they do. We learned that they analysis motion. We then did a practice sheet to see if we could tell if the motion was slowing down or accelerating with ticker tape. If the dots are closer together the speed will be fairly slow, and the more distance between the dots means the more speed it has.
By the time we got through the practice sheet it was close to the bell, so we briefly went over a hand out called Motion in Our World- Motion Technology Project and what we will be doing in Fridays class.
Next is Mary…
Tuesday, 4 October 2011
Work Period
Last class we reviewed the formula (Vav=d/t) which lets us find the average speed of something, and how to change that formula if we have different variables. We also got eight questions from the textbook that we were to work on.
Today for the majority of the class we worked on the questions we got last day, Once everyone was done we went through the answers together.
We have a quiz on Thursday that is for marks.
Next Is Tori..
Today for the majority of the class we worked on the questions we got last day, Once everyone was done we went through the answers together.
We have a quiz on Thursday that is for marks.
Next Is Tori..
Monday, 3 October 2011
Average Speed
Last class we learned a formula that allows us to find the average speed of an object or person (Vav=d/t), and we did several examples.
Today in class we reviewed the formula. After that we learnt how to change the way the formula was written when we have different variables for the formula. an example would be we are given an average speed of 5.1km/h and a time of 6.0h, and then we are told to find the distance traveled. We find the distance by going d=(Vav)(t).
We ended the class by going into groups and starting an assignment in the Science 10 textbooks and answering questions 1-7, and 10.
Next is Ashley.
Saturday, 1 October 2011
Calculating Speed
Last class we went through how to calculate the speed of vehicles in motion by converting seconds into hours and feet into kilometres. Next we calculated the speed by doing the formula V=t/d.
We then learned the formula to calculate the average speed which is Vav=d/t. We did an example where we had to find out Juan's average speed in m/s and km/h. Here is a video to show how to calculate average speed: http://www.youtube.com/watch?v=y40aVo90ETE
This relates to the other topic that we did on observing what kind of motions we saw in the videos of skateboards, car race etc. because we were observing the motion and speed of the vehicles on the road and stating wether Juan's speed or motion was uniform or not.
Next is Aimee
Friday, 30 September 2011
Measuring Motion
Brodie Brown
In class we started by reading an article called "Nature Offers Key Lessons On Harvesting Solar Power, Say Chemists." After that we talked about measuring motion. How do we measure motion and what tools or devices we could use to measure motion? To end the class, we did an experiment with toy cars, meter stick, and a stop watch. With either the wooden car, pull back car or battery powered car, we took a distance and timed how long it would take that car to travel that distance.
Next is Zack
Thursday, 29 September 2011
speeding test
Today in science we finished up yesterdays experiment on the cars. We figured out the average traveling speed of each car and the pull back car was the fastest then the battery car and then last was the wooden car. We then went outside and measuered a stretch of grass beside the highway and we timed how long it took the cars to get from point A to point B and we were in the middle of the calculations when the bell rung.
Next is alicia
Monday, 26 September 2011
Determining significant digits
We looked at Colin’spost. Then we go a handout telling us some rules about significant digits.Absent is when there is no decimal and you start on the right and move lefttill you see the first number between 1-9 and then count to the end. Present iswhen there is a decimal and you start on the left and move right till you seethe first number that is not a 0 and count to the end.http://www.youtube.com/watch?v=-QvtNvOACaU
Wednesday, 21 September 2011
Converting Units of Measurment
Today in class we went through our understanding concepts sheet with the class and finished questions 2-4. Mr. Banow also gave us a sheet on how to convert units if measurment and move decimal places using the Stair Case and the Ratio Method. After he finished teaching us how to use these methods he gave us questions or examples to do on our own. Once we were all finished the questions we went over it with the class. Towards the end of class Mr. Banow gave the class a sheet with the letters A,B,C,D on it. We used that sheet to do our multiple choice questions. If you would like to know how to convert units of measurment using the Ratio Method click the link. :) http//www.youtube.com/watch?v=XKCZn5MLKvk
Colin is next.
Colin is next.
Monday, 19 September 2011
Beginning of Unit Two: Motion in Our World
Today in science we got our Science & Technology tests back and went over them as a class. Then we started our new unit called Motion in Our World by watching a Myth Buster episode. In this episode they tested to see if running or walking threw rain would make a difference on how wet you got. They did two trials, in the first one they tested it by using homemade rain and got the results that running through water would cause you to get more wet. Then after that they did a second trial using real rain because people questioned if the results were accurate or not and they found out that walking through rain cause's you to get more wet. We then started a experiment called Measuring by hand.
Matthew is next .
Friday, 16 September 2011
Finishing the graph
Today in science we finished the graph we started working on yesterday. We learnt that you could put little circles around the dots of your graph if your graph is not 100% accurate. It also is easier for us to make a straight line because you shouldn't actually connect the dots. We learnt that we needed to put the title, axis title, and equivalent numbers on our graph. After we finished our graph we started reading an article about science and technology. The article explains the differences about science and technology.
Next is Jade.
Next is Jade.
Wednesday, 14 September 2011
Graphs
Today in class we learned about graphs and how they are easier to use then having a big quantity of data. we did an experiment on how fast we could do an activity involving saying something favorite of ours while putting a ball over are heads and then moving it side ways to the next person as quick as we could.We kept track of how many people we had each trial we did and how fast we went.After we finished we started making a graph to represent the data.
Jamie is next
Jamie is next
Tuesday, 13 September 2011
Tuesday September 13th
In class we discussed the terms for the scientific method. After that we did an experiment to go along with the scientific method. We made predictions about how many drops of water would fit onto a penny, after our guesses we did the experiment to see how close our predictions were, we did 5 trials to see if it was accurate or not. After that we mixed dish soap into the water, we made predictions again of how much water we thought the penny would hold, we did 5 trials for this one as well. To finish this experiment we did an analysis and explained what we saw in our trials.
Science 10 Unit Quiz
There will be a quiz in Science 10 to complete this first unit on the Nature of Science. The Quiz will be in class on Friday, Sept. 16.
The topics are:
Why study science?
What is science?
What is technology?
Applying the Scientific Method: Using the specific steps of the scientific method, explain steps I could follow to fix a specific problem. For example, how could you follow these steps if your computer did not turn on?
i. Ask a Question
ii. Form a Hypothesis
iii. Design an experiment – explain independent, dependent, and controlled variables
iv. Perform the experiment and analyze the results
v. Share the results
Junk Science
Formalized hypotheses
Variables
Tuesday, 30 August 2011
Welcome to Science 10!
You have found our class website. You may want to bookmark this page.
We will mainly use this blog to summarize each of our lessons. At the end of each unit it will serve as a great summary and review of what we have covered.
I encourage you to take this seriously as a useful tool to improve achievement. If you do, I think you will find that this is a great resource.
We will mainly use this blog to summarize each of our lessons. At the end of each unit it will serve as a great summary and review of what we have covered.
I encourage you to take this seriously as a useful tool to improve achievement. If you do, I think you will find that this is a great resource.
Subscribe to:
Posts (Atom)